Frankie Reed · 11 October 2026
Mapping Peak Wind Interference Patterns on Elevated Photovoltaic Arrays in Isolated Highland Settlements Using Multi-Year Sensor Logs
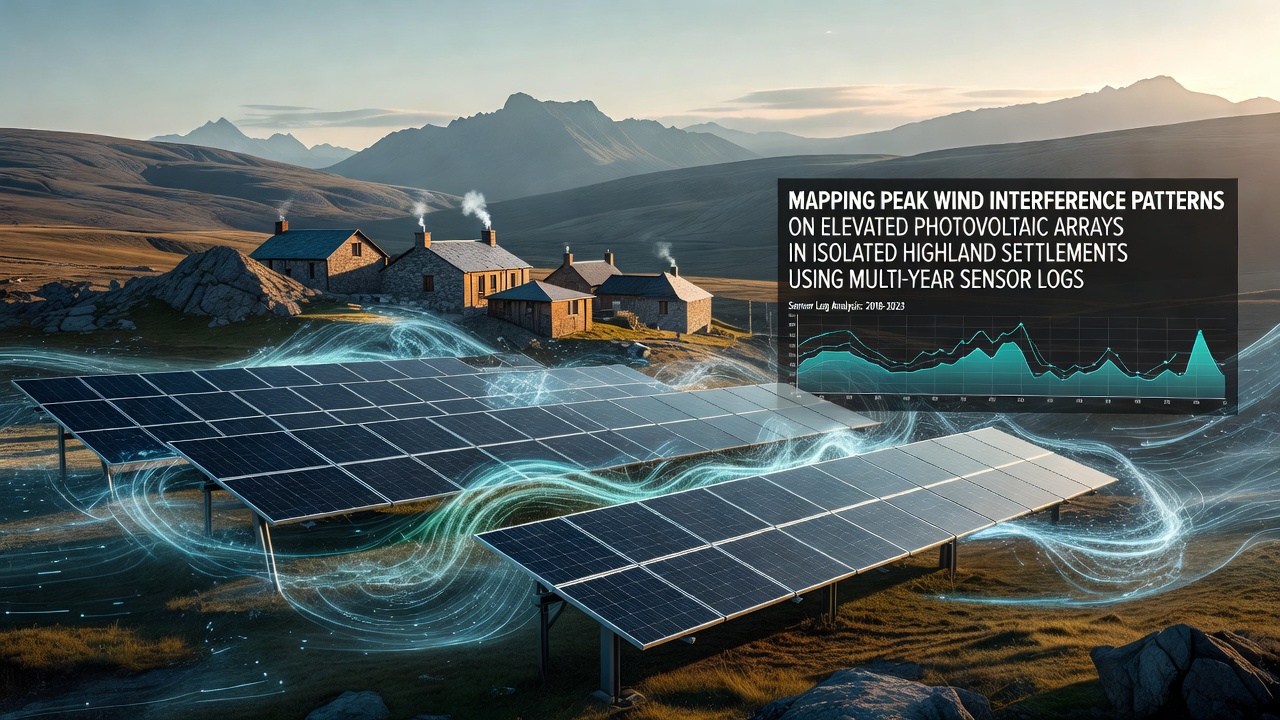
Isolated highland settlements rely on elevated photovoltaic arrays to capture consistent solar resources while contending with variable wind conditions that create interference patterns across panel surfaces. Multi-year sensor logs provide the primary dataset for mapping these peak interference zones, where turbulence from terrain features interacts with array structures. Researchers compile continuous readings from anemometers, pressure sensors, and vibration monitors installed at multiple heights and positions along the arrays, allowing precise identification of recurring wind events that exceed baseline thresholds.
Data collection spans several annual cycles, with instruments recording wind speed, direction, gust frequency, and corresponding structural responses every fifteen minutes. Analysts cross-reference these measurements against topographic maps of surrounding ridges and valleys, revealing how local geography amplifies certain wind flows. In regions such as the Andean plateaus and the Scottish Highlands, sensor networks have documented interference peaks that align with seasonal shifts in prevailing winds, particularly during transitional periods when stable high-pressure systems give way to frontal activity.
Sensor Network Design and Log Processing
Engineers position sensors at leading edges, mid-sections, and trailing rows of elevated arrays to capture both incoming flow and downstream wake effects. Each installation includes redundant power supplies and data loggers that transmit readings via satellite links to centralized repositories. Processing pipelines filter raw logs for outliers caused by temporary equipment faults or extreme weather events that exceed sensor calibration ranges, then aggregate hourly averages into monthly and yearly summaries. Pattern recognition algorithms identify clusters where wind interference exceeds 15 meters per second for sustained durations, flagging these as peak events requiring further spatial mapping.
Geographic information systems overlay the processed sensor data onto three-dimensional models of settlement terrain and array layouts. This integration highlights corridors where accelerated wind channels form between panels and nearby slopes. Observers note that elevated mounting heights above two meters increase exposure to these channels, while specific panel tilt angles can either mitigate or intensify surface turbulence depending on wind direction relative to the array orientation.
Analysis of Multi-Year Patterns
Longitudinal examination of sensor logs from 2022 through October 2026 shows consistent annual recurrence of interference peaks during late autumn and early spring months. These periods correspond with increased frequency of katabatic winds descending from higher elevations and mixing with regional synoptic flows. Statistical comparisons across multiple settlements indicate that arrays positioned on windward slopes experience 30 to 40 percent higher peak interference counts than those on leeward sides, according to aggregated records maintained by research teams at institutions including the National Renewable Energy Laboratory.
Additional processing of vibration and strain data reveals structural resonance points that coincide with specific wind interference frequencies. Panels mounted at greater elevations demonstrate amplified oscillation amplitudes during sustained gust sequences, prompting adjustments in mounting hardware specifications for new installations. Canadian government reports from Natural Resources Canada document similar findings in high-altitude test sites, where sensor-derived maps guided repositioning of arrays to reduce cumulative fatigue on support structures.
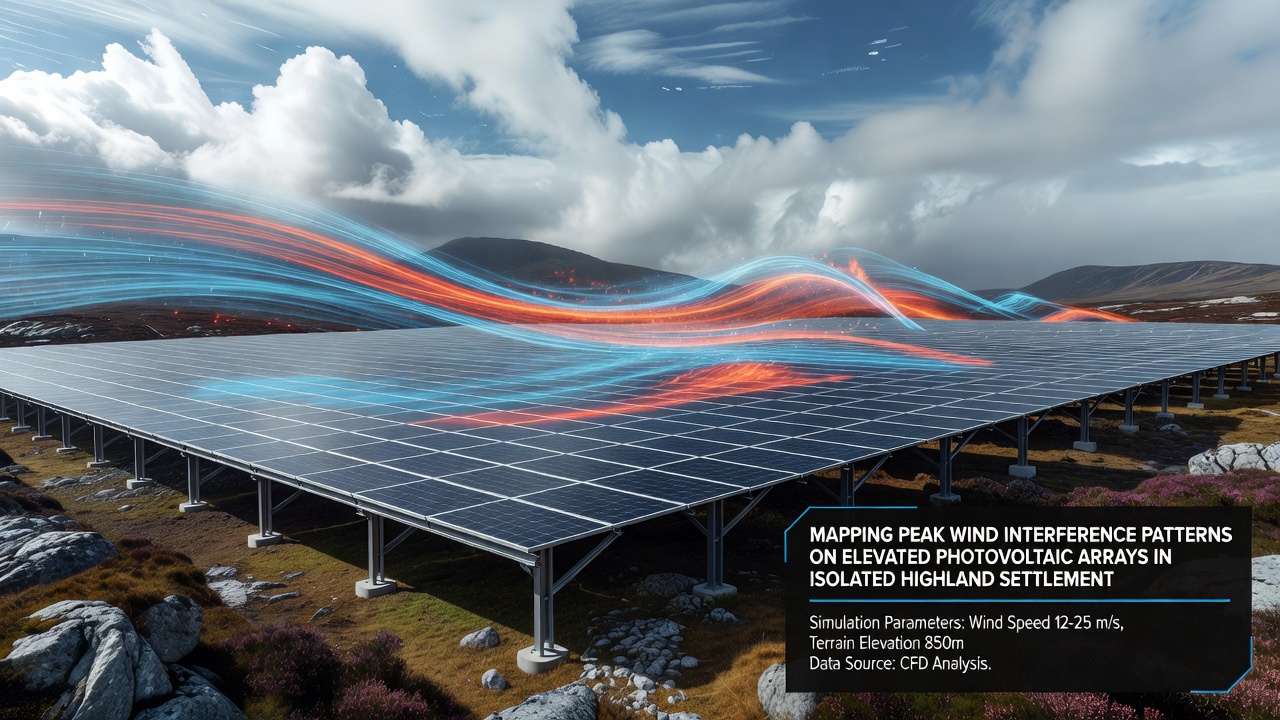
Case studies from individual highland communities illustrate the practical application of these maps. In one settlement, relocation of two array rows based on interference hotspots reduced recorded peak events by nearly half within the following monitoring year. Another location incorporated windbreak elements at identified channel entrances after reviewing five years of directional data, resulting in measurable stabilization of panel surfaces during documented high-wind episodes. Such outcomes emerge directly from the spatial patterns extracted from the sensor archives rather than from generalized modeling assumptions.
Integration with Broader Environmental Monitoring
Multi-year logs also incorporate ancillary meteorological parameters such as temperature gradients and humidity levels that influence air density and wind behavior. These combined datasets support refined interpolation between sensor points, generating continuous interference surfaces across entire array fields. Academic research groups have published findings in peer-reviewed journals demonstrating that terrain-induced vortices produce repeatable interference signatures detectable in the logs even when direct wind measurements remain below peak thresholds.
Settlement operators use the resulting maps to schedule maintenance during periods of lower interference probability and to prioritize structural inspections following documented peak events. The approach avoids reliance on short-term campaigns by emphasizing the statistical robustness that only extended sensor records can provide.
Conclusion
Mapping peak wind interference patterns through multi-year sensor logs supplies highland settlements with actionable spatial intelligence for managing elevated photovoltaic arrays. The method transforms continuous instrument readings into detailed visualizations that reflect actual site conditions across multiple seasons and years. Continued expansion of these monitoring networks will further refine interference predictions as additional settlements contribute comparable datasets to shared repositories.